
“I never saw the point of graphs before you taught me, now I use them all the time” This lovely comment was from a student in my Year 12 Further Maths class. I took pride in this as I do make a very deliberate point of establishing connections between algebraic forms and graphical forms to students. Often students start Year 12 with insecure graph work and a poor sense of the purpose or usefulness of graphs. Perhaps they see it as a stand-alone topic; ensure they know y=mx+c and some graph transformations and wait for those questions to crop up at GCSE. Students could get by with a shallow understanding and appreciation of the value of graphs at GCSE (like many other mathematical concepts) and then come undone at AS level.
So, what is my approach at Year 12? Looks for every single relevant opportunity to make connections between what we’re leaning algebraically and what it looks like on a graph. This is actually not very difficult at all. Depending on the context, I use the following strategies:
- Graph Sketching: Students have their own whiteboard and pen so it’s COVID safe and removes the need for handing them out. Students are also required to sketch in their books/notes. Some don’t like this as mistakes could turn messy, but I say that maths is sometimes messy! I am often explicit about the time that each sketch should take – from 10 seconds to perhaps a minute or two
- Dynamic Geometry: I love dynamic geometry software and have blogged much about using Geogebra in lessons. I use Geogebra to help explain concepts, model, make connections, and to check answers. Often I do this myself on the board to show students, and in non-pandemic times students would have the opportunity to play with the software individually on laptops
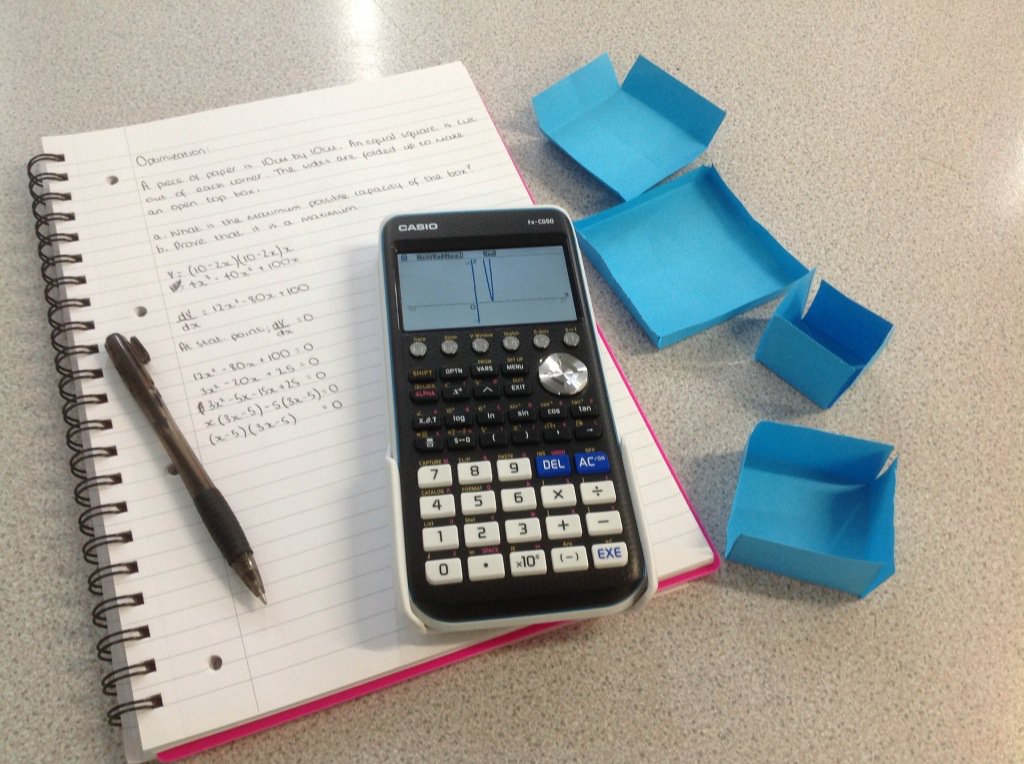
- Graphical Calculators: Yes they are expensive, but they are worth it. This year I made a video guide of the basics to be shown to all Year 12 classes so that students could start using them effectively from September. I make an effort to remind students on a lesson by lesson (sometimes question by question!) basis to check their work using the calculators and this often includes the use of graphs
- Tasks: This year I am casting a critical eye over the tasks I set for students. Some of these tasks I have used for years and I’m sure there’s room for improvement. I am reading Chris McGrane and Mark McCourt’s new book on Mathematical Tasks and this is providing inspiration for new interesting approaches and tasks. Many of the tasks outlined in the book help students with their conceptual understanding of graphs.
More than three quarters of the WJEC Unit 1 module (this is 60% of the AS course) can and should be taught with the aid of graphwork. As well as topics that obviously lend themselves to graph work, others such as the factor theorem and logarithms are worth exploring graphically too.
Is there anything we can do to prepare students for this graph onslaught at AS Level? Yes! The earlier students can understand and appreciate the value of graphs, the better their understanding will become and the transition to Year 12 Maths will be smoother. Once their understanding is improved, students are more likely to retrieve knowledge and build upon what knowledge they have. So, when teaching nth term sequences, make the connection to linear graphs. When teaching solving quadratics, get students to sketch the graphical representation. When introducing trigonometry, show students the significance of the unit circle. When teaching trial and improvement, show the trials graphically. When teaching compound interest or infection rates, demonstrate the growth with exponential curves.
Once students have given in and accepted that they’re going to have to learn to love graphs, the practise and understanding will come. It also makes students semi prepared for my next obsession when we finish Unit 1 and start the mechanics work…drawing a diagram!
